Chapter 5A

(AST405) Lifetime data analysis

Author

Md Rasel Biswas

5 Inference Procedures for Log-location-scale Distributions

5.1 Inference for location-scale distributions

  • Location-scale distributions have survivor function of the form (5.1)S(y;u,b)=S0(yub)<y< <u<andb>0

  • Log-lifetime Y=logT has a location-scale distribution with survivor function of the form


  • Lifetime variable T has a log-location-scale distribution with the survivor function ST(t;α,β)=S0(logtub)=S0[(t/α)β]

    • S0(w)=S0(logw) for w>0

    • u=logα

    • b=(1/β)


  • Lifetime and log-lifetime distributions

    • exponential, Weibull, log-logistic, log-normal, etc.

    • extreme-value, logistic, normal, etc.

Likelihood based methods

  • Goal is to estimate the parameters (u,b) or (α,β)

  • Some advantages of estimating (u,b)

    • Log-likelihood function for (u,b) is more closer to quadratic than that for (α,β)

    • Large sample normal approximations for (u^,b^) tend to be more accurate that those for (α^,β^)

  • A better choice of parameters for obtaining MLEs and implementing normal approximations is (u,logb), which is used by most statistical software

Likelihood function

  • For a censored sample {(ti,δi),i=1,,n}, the likelihood function L(u,b)=i=1n[1bf0(yiub)]δi[S0(yiub)]1δi

    • yi=logti

    • f0(z)=dS0(z)/dz pdf


  • The standardized variable zi=yiub

  • The likelihood function L(u,b)=i=1n[1bf0(zi)]δi[S0(zi)]1δi


  • The corresponding log-likelihood function (u,b)=rlogb+i=1n[δilogf0(zi)+(1δi)logS0(zi)]=rlogb+i=1ni(zi,δi)

    • r=i=1nδi

Score functions

(u,b)=rlogb+i=1ni(zi,δi)=rlogb+i=1n[δilogf0(zi)+(1δi)logS0(zi)]

(u,b)u=i=1ni(zi,δi)zi×ziu=i=1ni(zi,δi)zi×(1b)=1bi=1n[δilogf0(zi)zi+(1δi)logS0(zi)zi]


(u,b)=rlogb+i=1n[δilogf0(zi)+(1δi)logS0(zi)]

(u,b)b=rb+i=1ni(zi,δi)zi×zib=rb+i=1ni(zi,δi)zi×(zib)=rb1bi=1nzi[δilogf0(zi)zi+(1δi)logS0(zi)zi]

Hessian matrix

(u,b)u=1bi=1n[δilogf0(zi)zi+(1δi)logS0(zi)zi]

2(u,b)u2=u[(u,b)u]=1b2i=1n[δi2logf0(zi)zi2+(1δi)2logS0(zi)zi2]


(u,b)b=rb1bi=1nzi[δilogf0(zi)zi+(1δi)logS0(zi)zi] 2(u,b)b2=rb2+2b2i=1nzi[δilogf0(zi)zi+(1δi)logS0(zi)zi]+1b2i=1nzi2[δi2logf0(zi)zi2+(1δi)2logS0(zi)zi2]


(u,b)u=1bi=1n[δilogf0(zi)zi+(1δi)logS0(zi)zi]2(u,b)ub=1b2i=1n[δilogf0(zi)zi+(1δi)logS0(zi)zi]+1b2i=1nzi[δi2logf0(zi)zi2+(1δi)2logS0(zi)zi2]

Score function and information matrix

U(u,b)=[(u,b)u(u,b)b]I(u,b)=H(u,b)=[2(u,b)u22(u,b)ub2(u,b)bu2(u,b)b2]

Statistical inference

  • MLE

(u^,b^)=argmax(u,b)Θ(u,b)

  • Variance-covariance matrix

var(u^,b^)=[I(u^,b^)]1=V^

  • Sampling distribution

(u^b^)N2([ub],[I(u^,b^)]1)

Wald type CIs

  • For a large n, (u^,b^) follows a bivariate normal distribution with mean (u,b) and variance matrix V^

  • Standard error of u^ and b^ can be obtained from the diagonal elements of V^ se(u^)=V^111/2andse(b^)=V^221/2


  • Following pivotal quantities follow standard normal distributions Z1=u^use(u^),Z2=b^bse(b^),Z2=logb^logbse(logb^)

    • se(logb^)=se(b^)/b^
  • (1p)100% confidence intervals u^±z1p/2se(u^)b^±z1p/2se(b^)b^exp{±z1p/2se(logb^)}

Quantiles

  • pth quantile of log lifetime Y P(Yyp)=pS0(ypub)=1pypub=S01(1p)yp=u+bwp

    • wp=S01(1p)=F01(p) pth quantile of S0(z), the standardize distribution

  • Estimate of pth quantile and the corresponding standard error y^p=u^+b^wpse(y^p)=V^11+wp2V^22+2wpV^12

  • Pivotal quantity Zp=y^pypse(y^p)N(0,1)

  • (1q)100% confidence interval for yp y^p±z1q/2se(y^p)

Likelihood ratio procedures

  • Normal approximation based confidence intervals could be inaccurate for small samples

  • An alternative to normal approximation, bootstrap simulations can be used to estimate the distributions of pivots

  • All these methods can perform poorly in small samples with heavy censoring

  • Implementation of likelihood ratio based confidence intervals is relatively complicated, but LRT based CI often performs better in small and medium-size samples


  • To test the hypothesis H0:u=u0, the following likelihood ratio test statistic can be used Λ1(u0)=2(u^,b^)2(u0,b~(u0))

  • MLEs (u^,b^)=argmax(u,b)Θ(u,b)unrestrictedb~(u0)=argmaxbΘ1(u0,b)under H0


  • Under H0:u=u0, asymptotically Λ1(u0)χ(1)2

    • Approximate two-sided (1p)100% confidence interval for u can be obtained as the set of values of u0 for which Λ1(u0)χ(1),1p2

Homework - 1
  • Obtain the expression of likelihood ratio test statistic based confidence interval for the scale parameter b

  • The pth quantile of location-scale distribution can be expressed as yp=u+wpb,wherewp=S01(1p)

  • To obtain confidence intervals for a quantile, consider the null hypothesis H0:yp=yp0

  • The corresponding likelihood ratio test statistic (5.2)Λ(yp0)=2(u^,b^)2(u~,b~)


Steps

  • The estimates u^ and b^ are MLEs under H1 (u^,b^)=argmax(u,b)Θ(u,b)

  • Steps to obtain MLEs u~ and b~, under H0:yp=yp0

    1. Under H0, yp0=u+wpbu=yp0bwp

    2. b~=argmaxbΘ(yp0wpb,b)

    3. u~=yp0wpb~

  • (1q)100% Confidence interval for yp can be obtained from the set of yp0 values such that Λ(yp0)χ(1),1q2


  • To obtain confidence interval for S(y0), consider the null hypothesis H0:S(y0)=s0

  • The same likelihood ratio statistic can be used to test the hypothesis Λ(s0)=2(u^,b^)2(u~,b~)


Steps

  • Steps for obtaining MLEs u~ and b~ under H0

    1. Under H0:S(y0)=s0 S(y0)=S0(y0ub)=s0u=y0S01(s0)b

    2. b~=argmaxbΘ(y0S01(s0)b,b)

    3. u~=y0S01(s0)b~

  • The (1p)100% confidence interval for S(y0) can be defined as the set of s0 values such that Λ(s0)χ(1),1p2


  • The likelihood ratio procedure can provide quite accurate confidence intervals when the number of failures is about 20 or more

  • Two-sided intervals perform better than one-sided intervals as the former giving more closer to nominal coverage than the other

5.2 Weibull and extreme-value distributions

  • The pdf of Weibull distribution f(t;α,β)=βα(tα)β1exp[(t/α)β]

    • α>0 and β>0 are scale and shape parameters, respectively

  • The pdf of extreme-value distribution f(y;u,b)=1bexp[(yu)/b]exp[e(yu)/b]=1bf0(yub)

    • u=logα

    • b=(1/β)

  • Extreme-value distribution is used to make inferences about Weibull distribution

Likelihood based inference procedures

  • Censored sample {(ti,δi),i=1,,n}

  • Define yi=logtiandzi=(yiu)/b


  • General expression of likelihood function (u,b)=rlogb+i=1n[δilogf0(zi)+(1δi)logS0(zi)]

  • For extreme-value distribution S0(z)=exp(ez)f0(z)=ddzS0(z)=exp(zez)


(u,b)=rlogb+i=1n[δilogf0(zi)+(1δi)logS0(zi)]

  • Log-likelihood function for EV distribution (5.3)(u,b)=rlogb+i=1n(δiziezi)
    • r=iδi
  • This log-likelihood function (u,b) is easily maximized to give u^,b^ (using software)

Score functions

  • The general expression for location-scale family can also help us find the expressions for the first (and also second) derivatives of (u,b).

  • General expressions (u,b)u=1bi=1n[δilogf0(zi)zi+(1δi)logS0(zi)zi](u,b)b=rb1bi=1nzi[δilogf0(zi)zi+(1δi)logS0(zi)zi]


  • For extreme-value distribution logf0(z)z=zlog{exp(zez)}=1ezlogS0(z)z=zlog{exp(ez)}=ez

  • These gives straightforward expressions for the first and second derivatives of (u,b), which can be used to find MLEs, u^,b^

Hessian matrix

  • Hessian matrix at MLEs u^ and b^ H(u^,b^)=1b^2[ri=1nz^iez^ii=1nz^iez^ir+i=1nz^i2ez^i]
  • For extreme-value distribution

2(u,b)u2=1b2i=1n[δi2logf0(zi)zi2+(1δi)2logS0(zi)zi2]=1b2i=1nezi where 2logf0(z)z2=z{1ez}=ez=2logS0(z)z2

2(u,b)b2|u=u^,b=b^=1b^2i=1nez^i=rb^2

From , it can be shown that the Hessian matrix will be

2(u,b)b2=rb2+2b2i=1nzi[δilogf0(zi)zi+(1δi)logS0(zi)zi]+1b2i=1nzi2[δi2logf0(zi)zi2+(1δi)2logS0(zi)zi2]=rb2+2b2i=1nzi[δi(1ezi)(1δi)ezi]1b2i=1nzi2ezi=rb2+2b2i=1nzi[δiezi]1b2i=1nzi2ezi

2(u,b)b2|u=u^,b=b^=rb^21b^2i=1nz^i2ez^i

2(u,b)ub=1b2i=1n[δilogf0(zi)zi+(1δi)logS0(zi)zi]+1b2i=1nzi[δi2logf0(zi)zi2+(1δi)2logS0(zi)zi2]=1b2i=1n[δi(1ezi)(1δi)eziziezi]=1b2i=1n[δieziziezi]=1b2[ri=1nezii=1nziezi]

2(u,b)ub|u=u^,b=b^=1b^2i=1nz^iez^i

Covariance matrix

  • Observed information matrix at MLEs u^ and b^ I(u^,b^)=H(u^,b^)=1b^2[ri=1nz^iez^ii=1nz^iez^ir+i=1nz^i2ez^i]

  • Covariance matrix of (u^,b^) V^=[I(u^,b^)]1


  • MLEs of α and β (Weibull model parameters) α^=eu^andβ^=1/b^

  • Covariance matrix of (α^,β^) (using multivariate delta method) var(α^,β^)=GV^G where G=[g1(u,b)dug1(u,b)bg2(u,b)ug2(u,b)b]=[eu^001b^2]

    • α=g1(u,b)=eu

    • β=g2(u,b)=(1/b)


  • Wald-type statistics based 100(1p)% CI for u and b u^±z1p/2se(u^)b^±z1p/2se(b^)b^exp[±z1p/2se(logb^)]

CI for (u,b) (LRT based)

  • Log-likelihood function corresponding to H0:b=b0 is (from ) (u,b0)=rlogb0+i=1n[δi(yiub0)e(yiu)/b0]
  • MLE of u under H0:b=b0 (u,b0)u|u=u~=01b0[ri=1ne(yiu~)/b0]=0u~(b0)=b0log[1ri=1neyi/b0]

  • LRT statistics Λ(b0)=2(u^,b^)2(u~(b0),b0)

  • 100(1p)% CI for b is defined by the set of b0 values such that Λ1(b0)χ(1),1p2

  • Similarly, confidence interval for u can be obtained using the corresponding LRT statistics (Homework)

CI for quantiles

  • The pth quantile of YEV(u,b) S(yp)=S0(y0ub)=(1p)exp[exp(ypub)]=(1p)ypub=log[log(1p)]=S01(1p)=wpyp=u+wpb

CI for quantiles (Wald)

  • The estimate of pth quantile y^p=u^+wpb^

  • Standard error of y^p (using the multivariate delta method) var(y^p)=[1wp]V^[1wp]=V^11+V^22wp2+2V^12wp

  • Large sample based 100(1q)% confidence interval for yp y^p±z1q/2se(y^p)

  • Find the 100(1q)% confidence interval for tp


CI for quantiles (LRT)

  • To obtain LRT statistic based confidence interval for the quantile yp, consider the following null hypothesis H0:yp=yp0

  • The corresponding LRT statistic Λ(yp0)=2(u^,b^)2(u~,b~)

    • The procedure of obtaining parameter estimates u~ and b~ (under H0) is explained in )
  • LRT statistic based (1q)100% confidence interval for yp can be obtained from the set of yp0 values such that Λ(yp0)χ(1),1q2

CI for S() (Wald)

  • To obtain confidence interval for survival probability S(y0)=S0(y0ub)=exp[exp(y0ub)]

  • We can defined ψ=S01(S(y0))=log[log(S(y0))]=y0ub

  • MLE and SE ψ^=y0u^b^var(ψ^)=aV^a=[1/b^ψ^/b][V^11V^12V^21V^22][1/b^ψ^/b]


  • (1p)100% CI for ψ ψ^se(ψ^)z1p2<ψψ^+se(ψ^)z1p/2L<ψU

  • Confidence interval for S(y0) L<log[log(S(y0))]Uexp[exp(U)]<S(y0)exp[exp(L)]

CI for S() (LRT)

  • Consider the null hypothesis H0:S(y0)=s0, where S(y0)=exp[exp(y0ub)]

  • The (1p)100% confidence interval for S(y0) can be defined as the set of s0 values such that Λ(s0)χ(1),1p2, where Λ(s0)=2(u^,b^)2(u~,b~)

    • The procedure of obtaining parameter estimates u~ and b~ (under H0) is explained in )

Example 5.2.1:

  • Leukemia remission time data were given in Example 1.1.7 and used as an example for the non-parametric methods (e.g. Kaplan-Meier method) described in Chapter 3

  • Two groups of patients (6MP and placebo), each group has 21 patients, were followed up to observed either remission or censoring times (in weeks)


Remission time data

glimpse(gehan65)
Rows: 42
Columns: 3
$ time   <dbl> 6, 6, 6, 6, 7, 9, 10, 10, 11, 13, 16, 17, 19, 20, 22, 23, 25, 3…
$ status <dbl> 1, 1, 1, 0, 1, 0, 1, 0, 0, 1, 1, 0, 0, 0, 1, 1, 0, 0, 0, 0, 0, …
$ drug   <chr> "6-MP", "6-MP", "6-MP", "6-MP", "6-MP", "6-MP", "6-MP", "6-MP",…
drug status n
6-MP 0 12
6-MP 1 9
placebo 1 21
  • Each group has 21 subjects, and all subjects of the placebo group were failed (end of remission) and drug group (6MP) has 12 censored times

  • Two separate Weibull distributions are assumed for the failure times of two treatment groups, e.g.

    • 6MP group: TWeibull(α1,β1),Y=logTEV(u1,b1)

    • Placebo group: TWeibull(α2,β2),Y=logTEV(u2,b2)

  • Objectives: Drawing inference about the parameters


  • Observed data {(ti,δi),i=1,,n}

  • Log-likelihood function (α,β)=i=1n[δilogf(ti;α,β)+(1δi)logS(ti;α,β)]

  • MLEs (α^,β^)=argmax(α,β)Θ(α,β)


Analysis of remission time data (Extreme-value distribution)

  • Define y=logt and corresponding probability density and survivor function f(y;u,b)=1bexp[(yu)/be(yu)/b]S(y;u,b)=exp[e(yu)/b]

  • Log-likelihood function ev(u,b)=logi=1n[f(yi;u,b)]δi[S(yi;u,b)]1δi

  • MLEs (u^,b^)=argmax(u,b)Θev(u,b)

survreg function

  • R function survreg() can also be used to fit distributions of log-location-scale family, its syntax is similar to the syntax of survfit()
survreg(formula, data, dist)
  • In formula, response is a Surv object, e.g. to model the variables time and status formula = Surv(time, status)1

  • Lifetime or log-lifetime distributions can be passed to survreg by the argument dist


  • Available lifetime or log-lifetime distributions include “weibull”, “exponential”, “gaussian”, “logistic”, “lognormal”, “loglogistic”, “extreme”

  • The time argument of Surv function is either a lifetime or a log-lifetime depending on whether the mentioned dist is a lifetime (e.g. “weibull”) or a log-lifetime (e.g. “extreme”) weibullformula = Surv(time, status)1extremeformula = Surv(log(time), status)1


Data for the treatment (6MP) group

d6mp <- gehan65 |> 
   filter(drug == "6-MP")
glimpse(d6mp)
Rows: 21
Columns: 3
$ time   <dbl> 6, 6, 6, 6, 7, 9, 10, 10, 11, 13, 16, 17, 19, 20, 22, 23, 25, 3…
$ status <dbl> 1, 1, 1, 0, 1, 0, 1, 0, 0, 1, 1, 0, 0, 0, 1, 1, 0, 0, 0, 0, 0
$ drug   <chr> "6-MP", "6-MP", "6-MP", "6-MP", "6-MP", "6-MP", "6-MP", "6-MP",…

Analysis of the treatment group using survreg function

w_sreg_6mp <- survreg(Surv(time, status) ~ 1, 
                  data = d6mp, dist = "weibull")
ev_sreg_6mp <- survreg(Surv(log(time), status) ~ 1, 
                  data = d6mp, dist = "extreme")

Extreme-value distribution

  • Estimates of model parameters u and logb
broom::tidy(ev_sreg_6mp)
# A tibble: 2 × 5
  term        estimate std.error statistic  p.value
  <chr>          <dbl>     <dbl>     <dbl>    <dbl>
1 (Intercept)    3.52      0.273     12.9  6.28e-38
2 Log(scale)    -0.303     0.278     -1.09 2.77e- 1

  • Variance-covariance matrix of (u^,logb^)
vcov(ev_sreg_6mp)
            (Intercept) Log(scale)
(Intercept)  0.07473057 0.03305811
Log(scale)   0.03305811 0.07750538

Analysis of remission time data using survreg function

  • The survreg() function returns estimates of (u,logb) and corresponding variance matrix

  • For making inference about Weibull distribution, followings are required

    1. estimate of (u,b) and the corresponding variance matrix

    2. estimate of (α,β) and the corresponding variance matrix

  • It is important to understand the methods to obtain estimates and the corresponding variance of (u,b) and (α,β) from the estimates and the corresponding variance of (u,logb)


Homework

  • Obtain the variance-covarince matrix of (α^,β^) and (u^,b^)

CIs of (α,β) (6MP group)

  • 95% CI using the sampling distribution of (α^,β^) α^±z.975se(α^)=33.765±(1.96)(9.23)=15.674to51.856β^±z.975se(β^)=1.354±(1.96)(0.377)=0.615to2.092

  • 95% CI using the sampling distribution of (u^,logb^) u^±z.975se(u^)=2.984to4.055α^±z.975se(α^)=exp(2.984)toexp(4.055)=19.76to57.698

    • Similarly logb^±z.975se(logb^)=0.849to0.243β^±z.975se(β^)=1/exp(0.243)to1/exp(0.849)=0.784to2.336

(Obtain the variance matrix of (u^,b^) using the sampling distribution of (u^,logb^))

  • 95% CI using the sampling distribution of (u^,b^)

u^±z.975se(u^)=2.984to4.055α^±z.975se(α^)=exp(2.984)toexp(4.055)=19.76to57.698

  • Similarly b^±z.975se(b^)=0.336to1.142β^±z.975se(β^)=1/1.142to1/0.336=0.876to2.979

  • Using the method described in , we obtain the LRT-based CIs for u and b

Plot of LRT statistic against different null values u0 and 95% confidence interval for u and α

Plot of LRT statistic against different null values b0 and 95% confidence interval for logb and β

95% confidence intervals for α and β by different methods
parameter method 6-MP
α Wald (α^) (15.674, 51.856)
NA Wald (u^) (19.76, 57.698)
NA LRT (21.933, 76.708)
β Wald (β^) (0.615, 2.092)
NA Wald (logb^) (0.784, 2.336)
NA Wald (b^) (0.876, 2.979)
NA LRT (0.726, 2.203)

Analyses for Placebo group

dplacebo <- gehan65 %>% 
  filter(drug == "placebo")

Model fit with the data of placebo group

w_sreg_p <- survreg(Surv(time, status) ~ 1, 
                  data = dplacebo, dist = "weibull")

Estimates of model parameters

broom::tidy(w_sreg_p)
# A tibble: 2 × 5
  term        estimate std.error statistic  p.value
  <chr>          <dbl>     <dbl>     <dbl>    <dbl>
1 (Intercept)    2.25      0.168     13.4  5.72e-41
2 Log(scale)    -0.315     0.174     -1.82 6.94e- 2

95% confidence intervals for α and β by different methods
parameter method 6-MP Placebo
α Wald (α^) (15.674, 51.856) (6.363, 12.601)
NA Wald (u^) (19.76, 57.698) (6.824, 13.175)
NA LRT (21.933, 76.708) (6.659, 13.25)
β Wald (β^) (0.615, 2.092) (0.904, 1.837)
NA Wald (logb^) (0.784, 2.336) (0.975, 1.926)
NA Wald (b^) (0.876, 2.979) (1.023, 2.077)
NA LRT (0.726, 2.203) (0.951, 1.868)

Quantiles and their CIs

  • Estimate of pth quantile y^p=u^+b^wp

    • wp=log[log(1p)]

    • u^=3.519 and b^=0.739 (for treatment group)

  • Wald-type CI (see for detail)
    y^p±se(y^p)z1q/2

  • Note the estimate of y^p depends on the estimate of u^ and b^, and the corresponding variance matrix

    • survreg() returns estimate and variance matrix for u^ and logb^

95% confidence intervals for different quantiles of treatment group (6-MP)
p wp y^p se(y^p) lower upper
0.25 -1.246 2.599 0.655 3.726 48.559
0.50 -0.367 3.249 0.264 15.357 43.225
0.75 0.327 3.761 0.395 19.822 93.241

Plot of LRT statistic against different null values yp0 and 95% confidence interval for y.25 and t.25 (6-MP group)

Plot of LRT statistic against different null values yp0 and 95% confidence interval for y.5 and t.5 (6-MP group)

95% confidence intervals of different quantiles using Wald and LRT method (6-MP group)
p lower upper lower upper
0.25 3.726 48.559 6.586 23.058
0.50 15.357 43.225 16.289 51.342
0.75 19.822 93.241 27.522 112.730

95% confidence intervals for different quantiles using Wald and LRT method (placebo group)
p lower upper lower upper
0.25 1.362 10.707 2.031 5.927
0.50 4.499 11.708 5.755 9.488
0.75 8.592 16.863 8.873 16.996

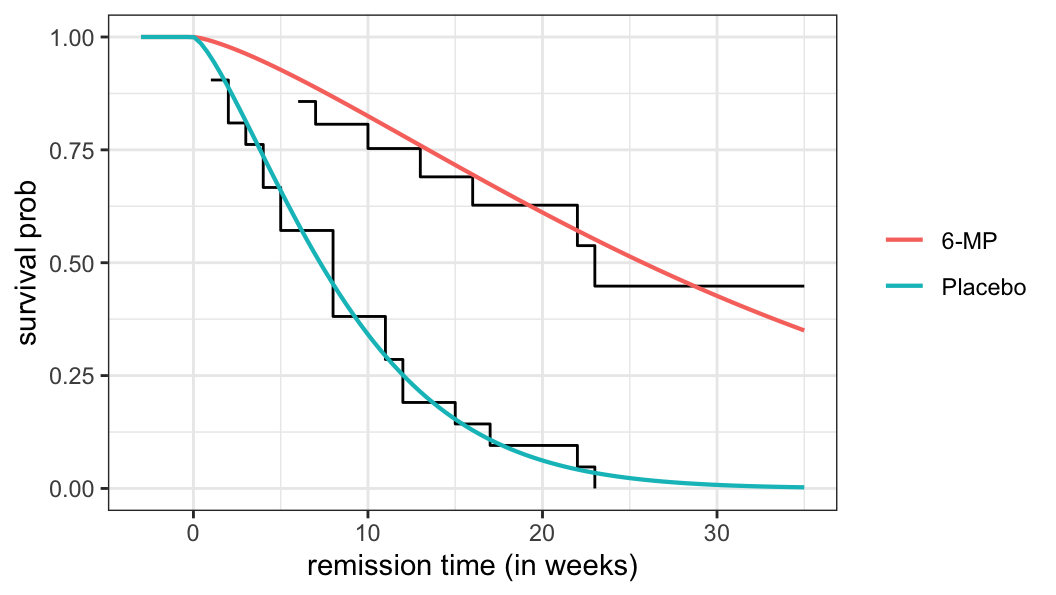
Survivor function

  • For Weibull distribution, the expression of survivor function S(t;α,β)=exp((t/α)β)

  • Estimated survivor function S(t;α^,β^)=exp((t/α^)β^)

par 6-MP placebo
α 33.765 9.482
β 1.354 1.370

Comparison survival probabilities of between two treatment groups

Figure 5.1: Comparison of parametric (Weibull) and non-parametric (step-function) estimates of survivor function using remission time data

Homework

  • Obtain Wald and LRT statistics based confidence interval for the survival probability S(10)